Use Hierarchical Bayesian Analysis to Better Predict Behavior
Decision Sciences & Innovation empowers our clients with end-to-end quantitative research solutions and custom advanced analytics. We deliver insights that are both easy to understand and actionable, enabling our clients to make better decisions for their business. Our comprehensive approach equips our team with the tools and confidence to solve complex business problems with our extensive and continuously evolving analytical toolbox and to translate data-driven insights into business solutions.

Discrete choice models are now widely used in market research, allowing researchers to study decision making and solve a range of business problems, such as pricing, product development, and demand estimation. In the development of these models, respondents are shown a series of scenarios listing various products or services, such as cell phones or cable TV offers, and asked to choose among the offers listed. These offers differ in price and features so we can understand how consumers make tradeoffs in decision making, without them having to tell us directly. The choices these respondents make is then used to predict how consumers will respond to products and services in the ‘real world’.
Hierarchical Bayesian (HB) Analysis is an effective tool that uses this choice information to construct a model. It allows the researcher to predict how consumers will respond to all possible combinations of features and prices tested. HB Analysis has become increasingly popular in analyzing survey data with good reason. More and more market research is now focused on the attitudes and behavior of individuals, and individual level data can be quite sparse. This technique differs from standard survey analysis in two distinct ways:
1. Rather than accepting survey results at face value, it determines the prior condition most likely to have resulted in the current findings. Consider the story below.
One rainy and moonless evening a pedestrian is struck by a cab which then speeds off into the night. Fortunately there is a witness who claims he saw a Black Cab run into the victim. Time is of the essence in finding the culprit before the taxi can be scrubbed of all evidence. Since there are only two taxi companies in the town the police sergeant on duty, who is in every way a conventional detective, orders his men to visit the Black Cab company to identify the driver.
The police lieutenant, however, who is a Bayesian detective, orders the men to go first to the Blue Cab Company on the other side of town. He has determined under the conditions of that evening that witnesses are only 80% accurate in their ability to distinguish black from blue cabs. He further notes that there were more blue taxis out that evening than black taxis. Taking this prior information into account he concludes that it is more likely that the pedestrian was struck by a blue taxi than by a black taxi.
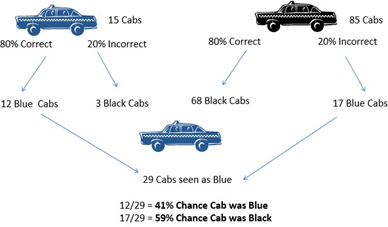
As can be seen in the image illustration, there are 12 ways that a Blue Cab is correctly identified as a Blue Cab and 17 ways that a Black Cab can be incorrectly identified as a Blue Cab. HB Analysis helps you use a known outcome to predict the likelihood of the event leading to that outcome. In this case, the use of priors makes it more likely that the witness actually observed a Black Cab rather than a Blue Cab.
2. The analysis uses group information to estimate the most likely responses of individuals.
Consider predicting end of season batting averages for Major League Baseball players – the following table shows the observed batting averages (hits per at bats) and the HB Analysis estimate of the likely average of members of the Cleveland Indians baseball team early in the season.
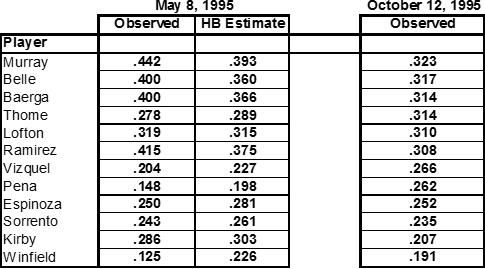
Since it was early in the season (May) when the estimate was made, the individual level data is sparse, showing both very high and very low averages. In the HB Analysis the group has a large effect and pulls all the estimated batting averages towards the team average. By the end of the season, as observed in October, the HB Analysis estimate had proven to be far more accurate than the observed individual level data alone.
It is easy to see why HB Analysis has become popular as a means of analyzing market research data, particularly choice-based conjoint models. The Bayesian approach to discrete choice holds that the likelihood of any future behavior is based on both the individual responses to the choice task and the responses of the group (i.e., how likely is it that this individual model is part of the population). The group serves as the prior information for the individual and the result is an increase in both accuracy and specificity beyond that found in standard modeling techniques.