What Truly Drives Your Business?
Decision Sciences & Innovation empowers our clients with end-to-end quantitative research solutions and custom advanced analytics. We deliver insights that are both easy to understand and actionable, enabling our clients to make better decisions for their business. Our comprehensive approach equips our team with the tools and confidence to solve complex business problems with our extensive and continuously evolving analytical toolbox and to translate data-driven insights into business solutions.

What is going to move my business in a positive direction? All organizations have asked themselves this question at one point. At KS&R, we frequently receive requests to test product (or service) features or attributes, to determine which are preferred, and ultimately which make a difference, and should be included in a product or service roll-out. While there are many ways to accomplish this, one that has proven particularly useful is Maximum Difference Scaling (MaxDiff). MaxDiff is easy to design, straightforward for respondents, and enables simple analysis and results interpretation.
Using MaxDiff, customers are asked to select the most and least important attribute across several different lists. The analysis uses these responses to calculate the derived importance of each attribute. A stand-alone MaxDiff is often compared to a traditional rating or ranking exercises where customers concretely state their importance; however rating or ranking exercises can come with some disadvantages such as:
- cultural biases
- not pure ratio-scale (e.g. a 5 point scale)
- lack of differentiation among attributes
- not usable with large number of attributes (MaxDiff is well suited for more than 10 attributes)
Anchored MaxDiff, on the other hand, allows researchers to combine derived and stated importance and helps to further differentiate the attributes tested. First, let’s look at Stand-alone MaxDiff and then how Anchored MaxDiff takes it a step further.
STAND-ALONE MAXDIFF
In a MaxDiff exercise, respondents are asked to trade-off attributes in several tasks that have been randomly generated. Attributes are shown in a balanced fashion to respondents, through the use of an experimental design. It should be noted that MaxDiff is appropriate when product bundles and price are not to be tested. If product bundles or price are to be tested, one should consider an alternative method like discrete choice.
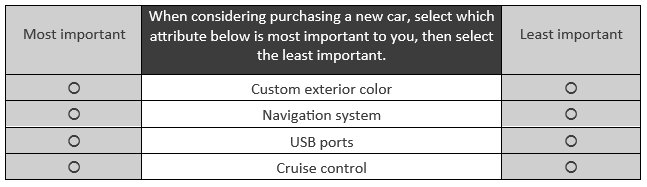
Each MaxDiff task includes a sub-set of the attributes in the full group. Respondents complete several tasks, with the actual number of tasks dependent on the number of attributes being tested. An example MaxDiff task card is shown below (let’s assume these 4 attributes are from a list of 12 total attributes):
MaxDiff data is prepared for analysis with the use of Hierarchical Bayes (HB) estimation. Keeping in mind that not all respondents see the same combination of sub-sets of attributes in a MaxDiff exercise, HB is a method by which individual estimates are calculated, across all attributes, by borrowing information from across the entire base of respondents. Through the use of HB, individual-level data is generated for each attribute, enabling users to analyze the data as though each respondent reacted to all possible combinations. The data resulting from a MaxDiff exercise is often presented similarly to how one would present rating or ranking data – as examples, it can be reported as relative importance via a share of preference out of 100% (aka chip allocation) or as the percentage of respondents ranking each item first, ranking each item in their top 3, etc.
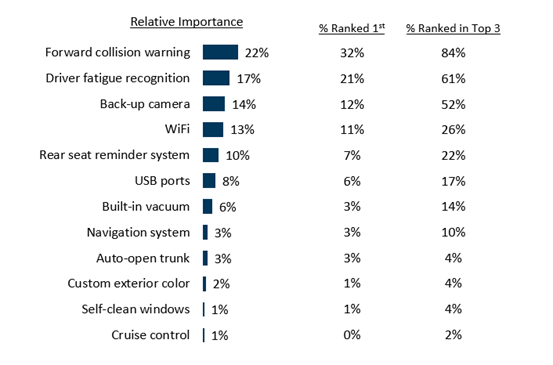
A stand-alone MaxDiff provides the relative importance of each attribute, which is nice to have, but taking it a step further, by adding an anchor question, enables us to understand which attributes are the must haves.
ANCHORED MAXDIFF
An enhancement to MaxDiff is to add an anchor question that is tied to a threshold (e.g., pricing, action, or preference). While a stand-alone MaxDiff can provide the relative importance of each attribute tested, it does not enable end users of the research to say, for example, “These 3-4 attributes are important enough to command extra dollars when consumers are considering purchasing a new car.”
Adding a multi-response follow-up question helps to facilitate that next level of analysis, which is what attributes tested actually matter or make an impact. When considering the anchor question, the threshold should relate to the study, and should be understandable by the respondents. In the new car example above, one might as…
Considering the list of new car attributes below, which attributes are so important that you would pay extra? (SELECT ALL THAT APPLY)
- Back-up camera
- Custom exterior color
- Driver fatigue recognition
- Navigation system
- USB ports
- Self-cleaning windows
- Cruise control
- Auto-open trunk
- WiFi
- Built-in vacuum
- Forward collision warning system
- Rear seat reminder system
- None of the above
In essence, the anchor question is used when there is a need to determine whether items in a list exceed an action or attitudinal threshold, so those items can be classified as impactful or not. The anchor question is built into the HB estimation and subsequently, the analysis phase, so that in the end, a literal line can be drawn to show which attributes are impactful (and would be worth investing in because consumers will pay more for them) and which attributes are considered “nice to have.”
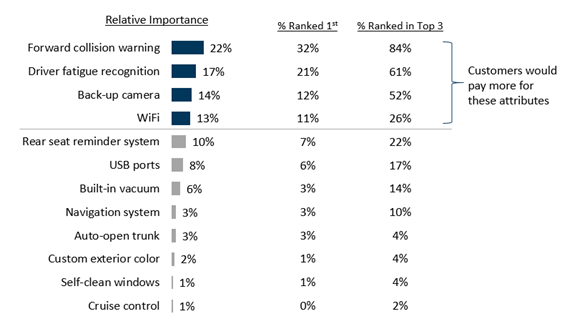
Because the anchor question does not take up much real estate in the survey, it is our recommendation to consider always including this valuable add-on that will provide greater insights. While it’s nice to know how attributes test against each other (as seen in a stand-alone MaxDiff exercise), the benefit of being able to measure the attributes against a meaningful threshold makes the anchor question a true asset.