Are your brand assets famous? More importantly… Is your business benefitting from that level of fame?
Dan takes pride in his ability to solve complex problems and drive successful real-world outcomes through rigorous methodologies and impactful consultation. Since joining KS&R in 2012, Dan has primarily focused on the Retail, E-commerce, and Logistics industries. Within this ever-evolving space, he works closely with clients to plan and execute global initiatives in the areas of price optimization, new product development, segmentation, value proposition, brand health and messaging, and customer journey. Away from work, you can find Dan spending time outside with his wife and son – swimming at a park, exploring the local food scene at a festival, or enjoying a day at the golf course.

THE PROBLEM
If you can’t answer these questions, you may have a need to conduct marketing research on your brand assets to…
- Build an understanding of which are best recognized by your target audience – meaning linked to your category; and
- Identify which of them that are well-known and linked to your brand rather than your competitors’ brands.
This approach is known as brand attribution research. It’s a great way to prioritize your assets, then think through when and where to use these assets across your marketing efforts and initiatives.
THE SET-UP
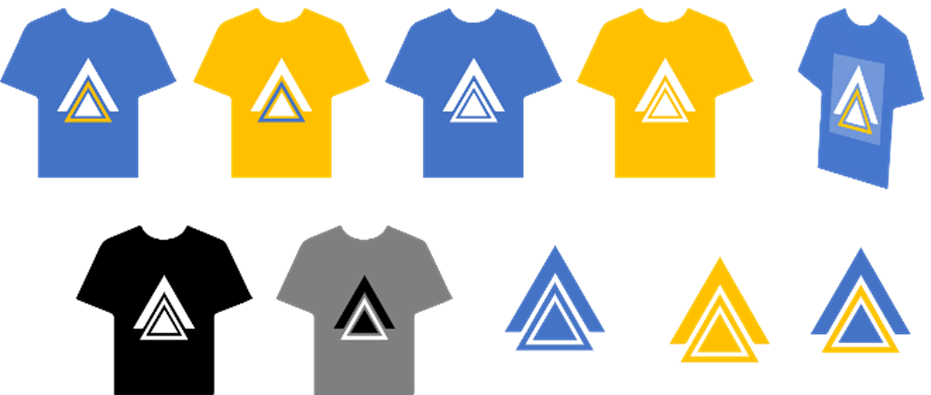
While a brand attribution study can be custom designed for any number of assets in scope, a set of 8-20 is recommended for best results. These assets can vary from logos to slogans to stylized brand name images, and even a jingle or song about your product.
Determining the set of assets to be included is the first step; careful consideration should be given to ensure these are assets that brand team(s) are considering for near or long term use. Unbranded logos are ideal as branded logos can be more easily identified by simply reading the text in the asset.
As an example, the following set of assets could be tested for a clothing retailer:
THE METHODOLOGY
An online survey is conducted among the target audience of category users – typically comprised of both customers and non-customers. The attribution activity includes showing different brand assets (images, slogans, etc.) for a very short amount of time and asking respondents to identify the company that they think the asset belongs to. Once time is up, the asset disappears from view.
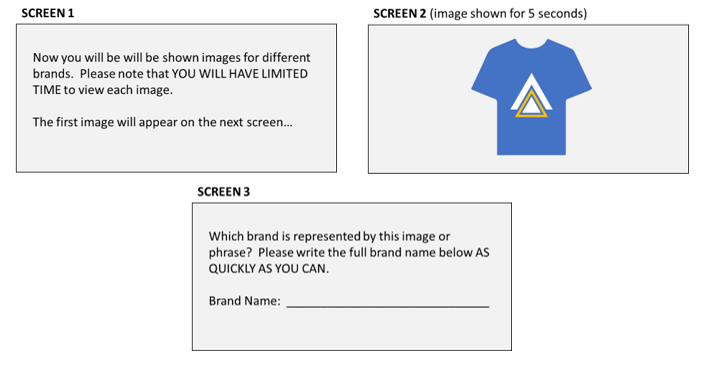
Each respondent only sees one of the test assets in this way. For a balanced design, each asset must be shown an equal number of times across the total sample and within any cells or segments of interest. During this activity, competitive assets can be shown for benchmarking purposes as well; these competitive assets should be shown after the tested asset to limit exposure bias that could potentially impact results. In a typical design, each respondent is exposed to 4 total assets, the test asset then 3 competitive assets from different competitors.
For an unbiased read, it is essential that the attribution activity is completed prior to any screening questions that may tip off respondents to the category. In our example, this means that any screening questions around clothing purchases need to come after the attribution activity.
Following the attribution exercise and screening questions, other activities may be completed around the full set of test assets, including brand perceptions ratings, messaging effectiveness, and/or a Max Diff exercise to measure asset linkage to brand.
THE OUTPUT
Following the online survey, results are scored on two key metrics:
Fame: The asset is considered famous if it is correctly linked to the category. So in our example, a response that links the asset to any clothing retailer, or just clothing overall, is scored as famous.
Uniqueness: The asset is unique if it is correctly attributed to your brand. Only correct responses are considered unique; typically, minor spelling errors are accepted if a reasonable assumption may be made that the respondent intended to type your brand name.
A quad map is constructed using these metrics…
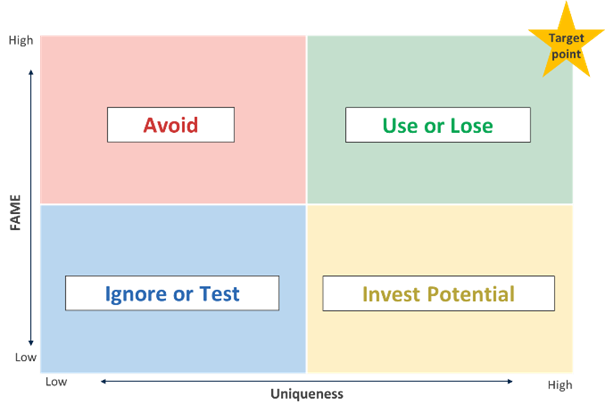
- Assets are placed on the y-axis based on their fame, the % of respondents that correctly linked the asset to the category.
- Assets are placed on the x-axis based on their uniqueness, the % of respondents that correctly attributed the asset to your brand among those that correctly linked it to the category.
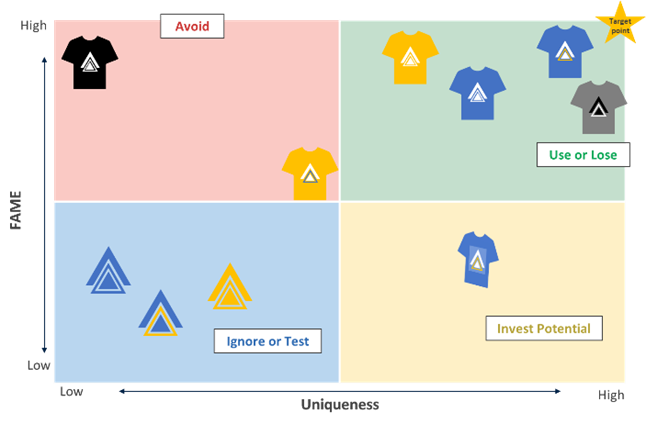
As shown above, assets are placed into categories based on this mapping…
Use or Lose – These are your assets that are most effective and should be used freely, being both famous and unique.
Invest Potential – These are your assets that are correctly linked to your brand when people recognize the category, but aren’t famous enough to be used frequently; investment is needed to make these assets famous.
Avoid – These are your famous assets that are often misattributed within your category. Using these is a significant risk since they may be just as likely to make your target audience think of your competitors rather than your business. Use should be limited, or consider retiring or replacing these assets.
Ignore or Test – Your assets in this category are neither famous nor unique. Using them is not risky, but also offers little upside. Further investigation is needed to determine an appropriate course of action for this set.
Beyond looking at this analysis among the full sample, the mapping can be created among key segments of interest. This can enhance how effectively you are able to place and leverage these assets and define more nuanced use cases for certain target audiences.
The time it takes respondents to correctly identify assets is also tracked and reported, providing an additional level of guidance around how quickly assets are recognized. This information is particularly useful when determining where to use each brand asset.
So… do you know where your assets fit? If not, it may be time to think about conducting a brand attribution study.